Japan Energy Briefing · Visual guide
Japan’s energy market, explained visually.
Six charts and frameworks for connecting policy direction, solar and storage economics, local data and commercial execution.
3 October 2026 · Enegaeru, Kokusai Kogyo · Official data, illustrative scenarios and editorial frameworks are labeled separately.
Tap any graphic to view it full size. Each chart also has a text explanation, assumptions and sources below it.
Official data + policy outlook
A changing power mix creates several different opportunities.
Read the diagram, assumptions and sources
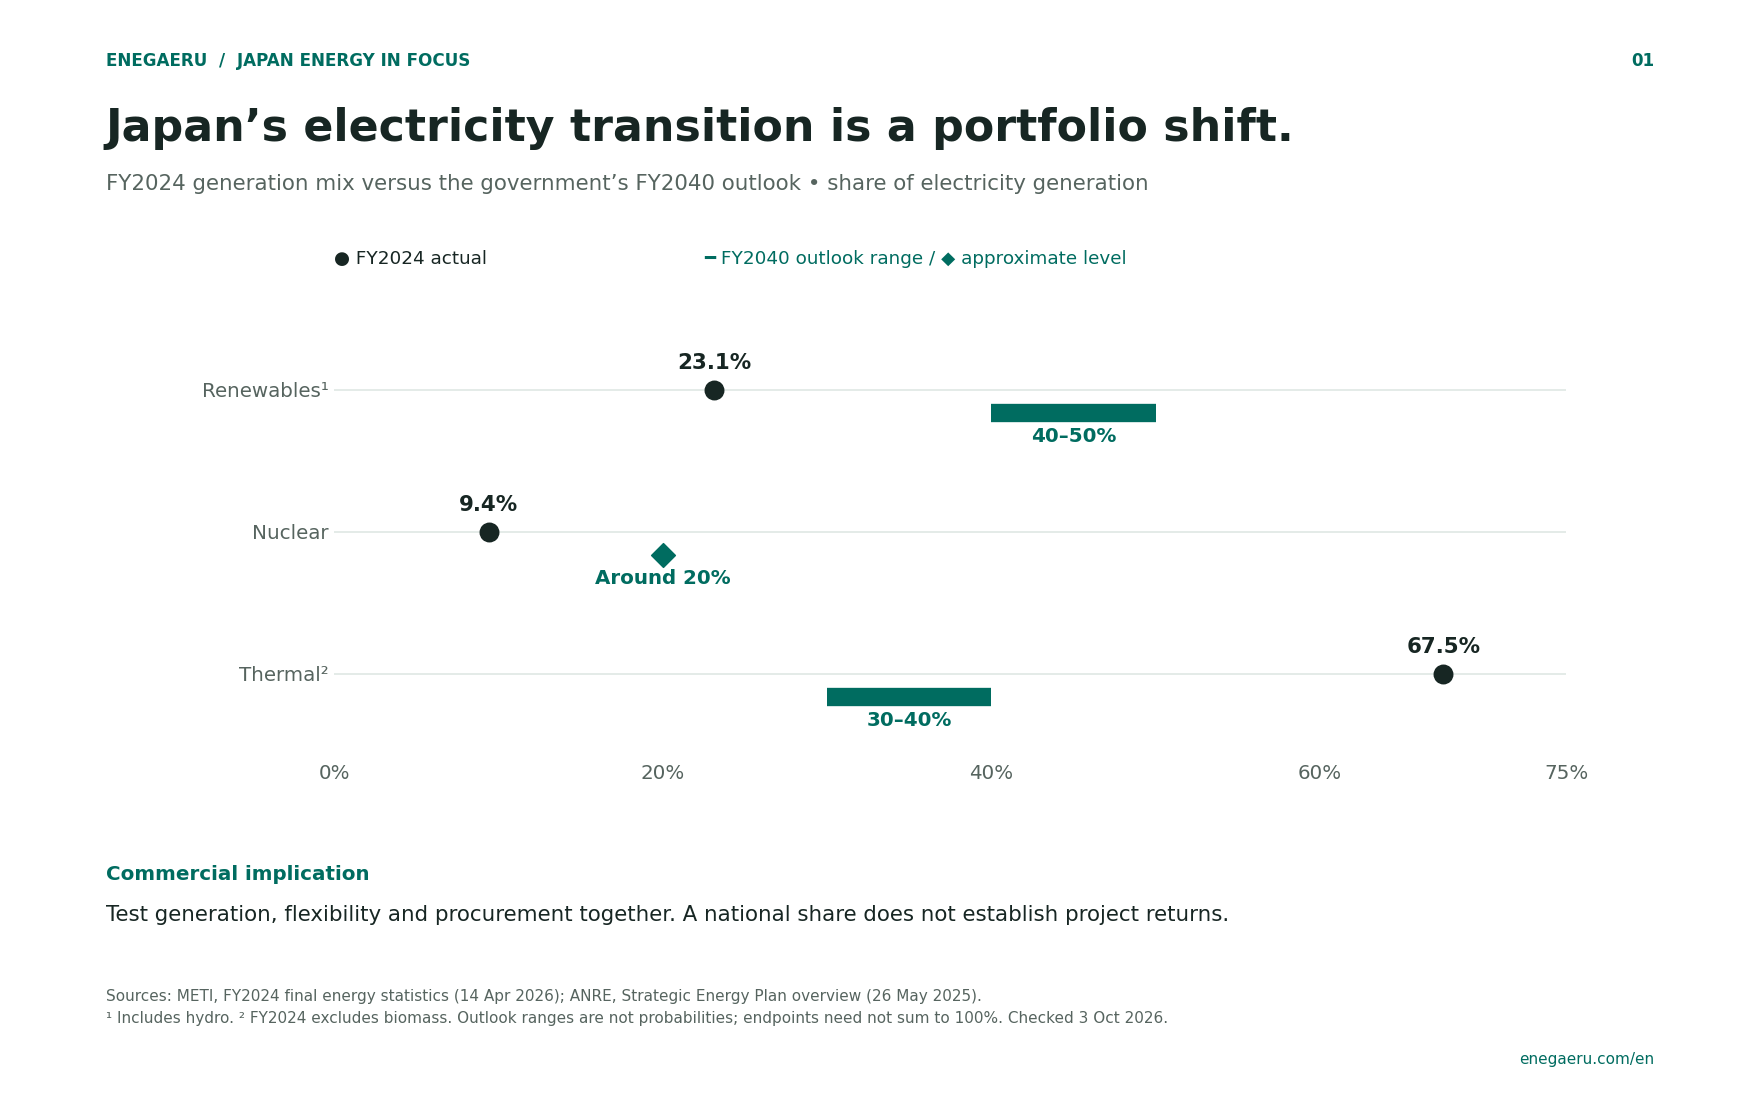
FY2024 actual electricity generation: renewables including hydro 23.1%; nuclear 9.4%; thermal excluding biomass 67.5%. The FY2040 government outlook shows renewables at 40–50%, nuclear at around 20% and thermal at 30–40%.
The actual values and outlook are different kinds of evidence. The ranges are not probabilities or independent forecasts, and their endpoints should not be added into a synthetic 100% mix. The graphic compares shares, not installed capacity or growth in absolute generation.
Sources: METI, FY2024 final energy statistics, 14 April 2026 (Japanese); ANRE, Strategic Energy Plan overview, 26 May 2025 (English). Checked 3 October 2026.
Illustrative energy accounting
Follow each unit of energy before pricing the benefit.
Read the diagram, assumptions and sources
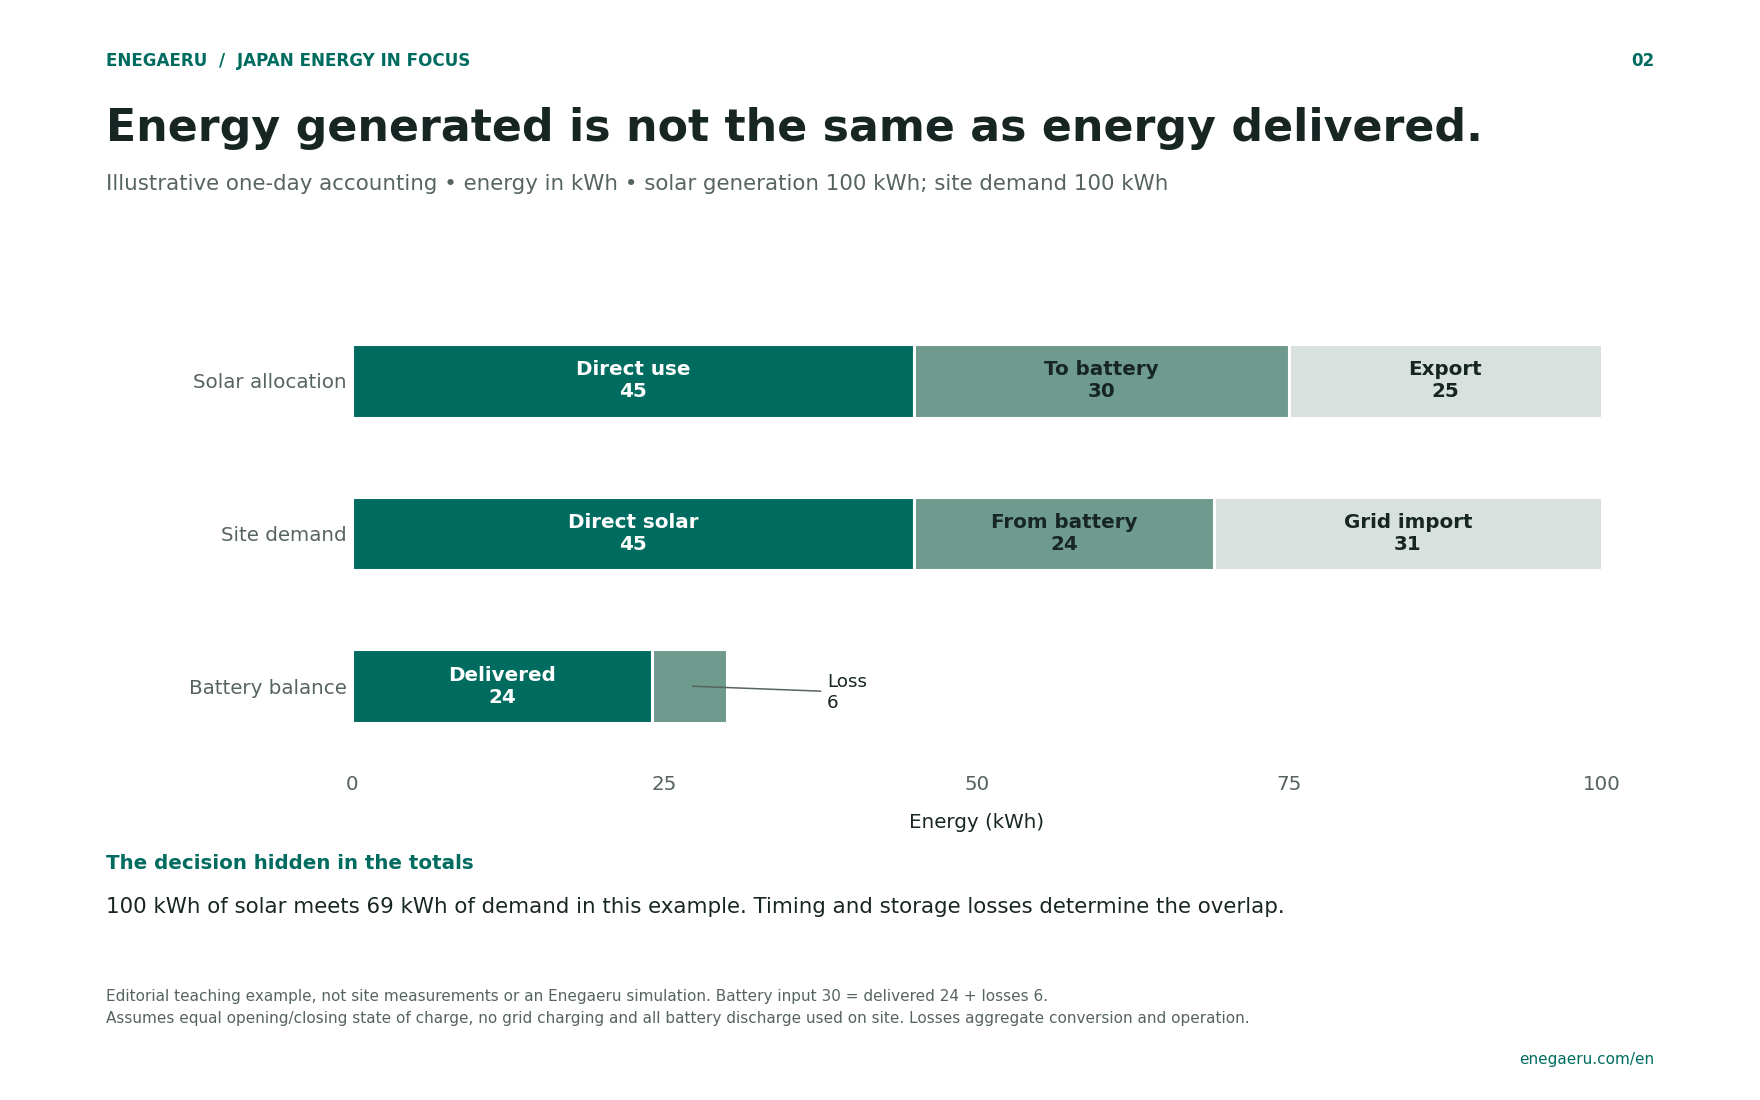
This teaching example assumes 100 kWh of solar and 100 kWh of site demand in one day. Solar allocation is 45 kWh direct use + 30 kWh charging + 25 kWh export. Battery output is 24 kWh with 6 kWh of losses. Demand is supplied by 45 kWh direct solar + 24 kWh battery output + 31 kWh grid imports.
Opening and closing battery state of charge are equal. No grid charging is assumed; all discharge serves the site. The 80% delivered-to-charged ratio is an illustrative assumption, not a default efficiency or manufacturer specification. Losses are aggregated for explanation. A real simulation needs time-series constraints, equipment specifications and the operating strategy.
This is neither measured site data nor an output from the Enegaeru software. The accounting checks are 45 + 30 + 25 = 100, 24 + 6 = 30 and 45 + 24 + 31 = 100 kWh.
Illustrative financial scenarios
Read the cash-flow curve beyond the payback date.
Read the diagram, assumptions and sources
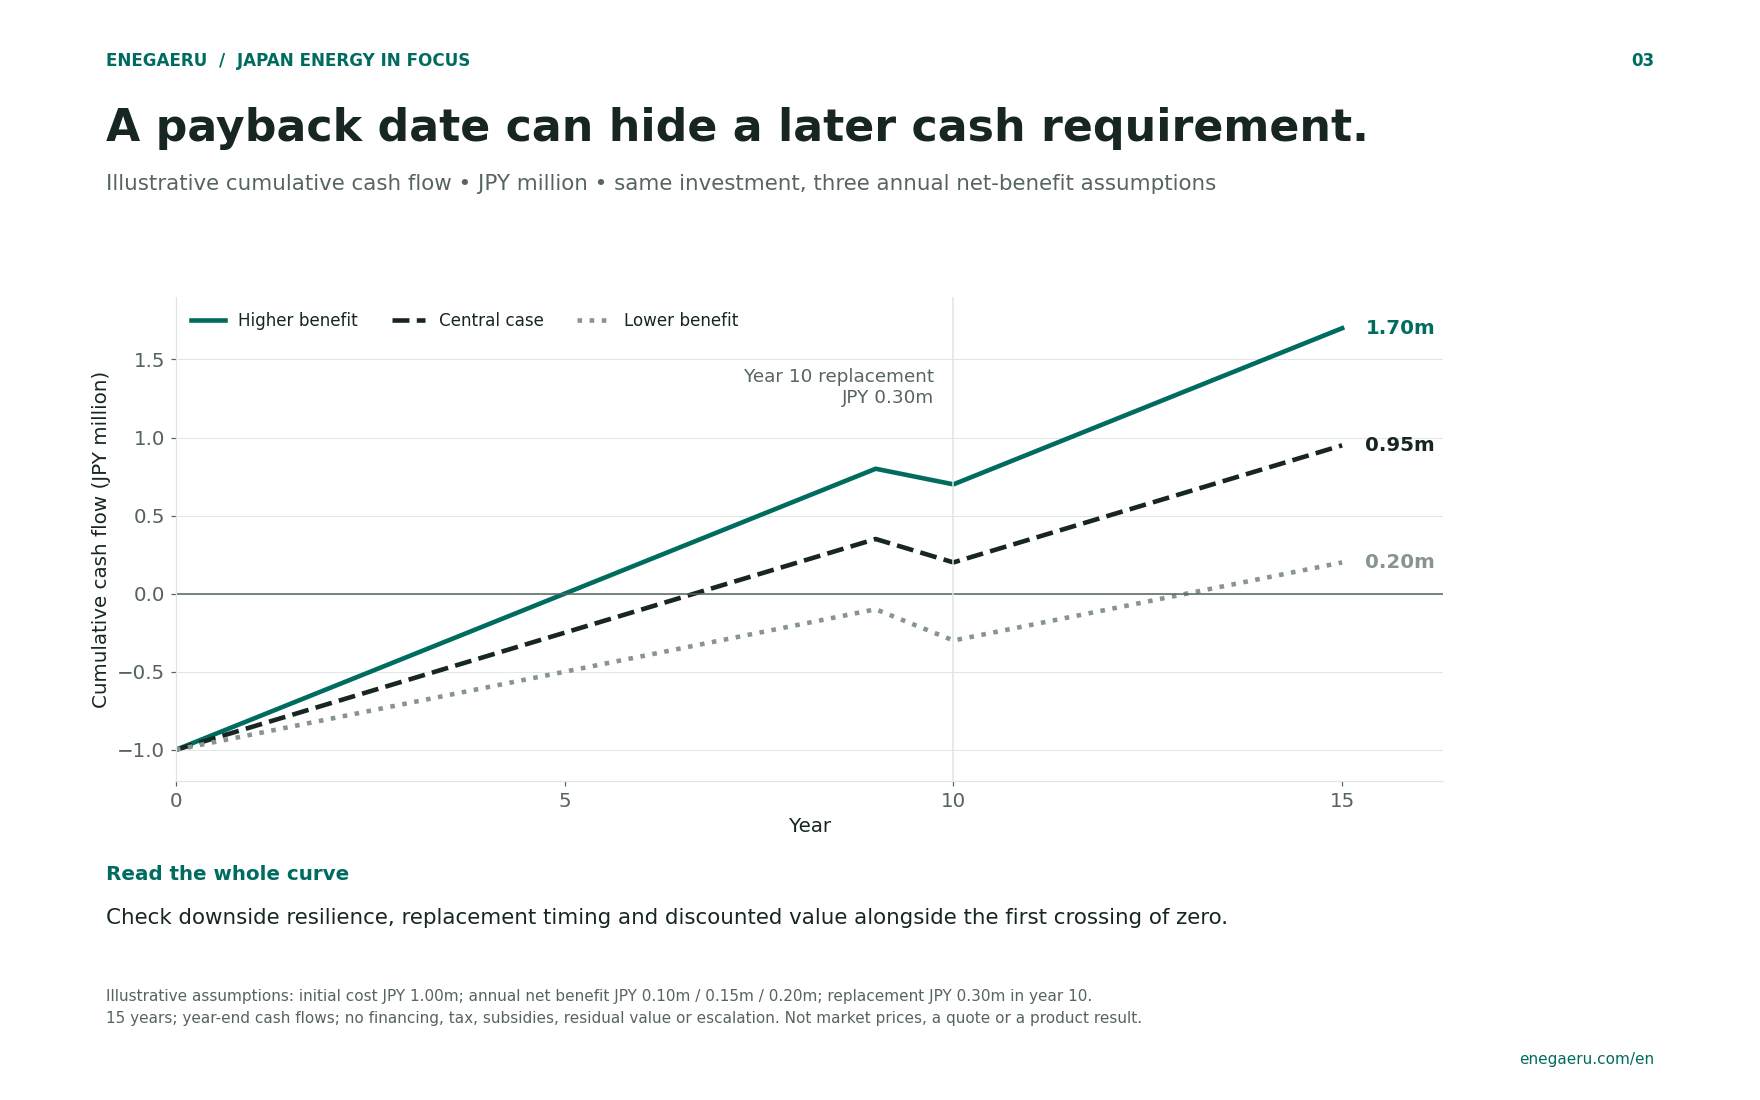
Common assumptions: JPY 1,000,000 paid at year 0; JPY 300,000 replacement cost at the end of year 10; 15 years of end-of-year cash flows. Annual net benefit before the specified replacement is JPY 100,000, JPY 150,000 or JPY 200,000. These are editorial assumptions, not market prices or quotes. The chart is undiscounted.
At an illustrative 3% annual discount rate, NPV is approximately −JPY 29,435 (lower benefit), JPY 567,462 (central case) and JPY 1,164,359 (higher benefit). NPV means the sum of cash flows discounted to year 0. Calculation: −1,000,000 + annual benefit × [1 − (1.03)−15] / 0.03 − 300,000 / (1.03)10.
No financing, taxes, subsidies, residual value, escalation or separate degradation is modeled. Annual net benefit is held constant. For a project decision, replace these assumptions with a consistent, project-specific model and test applicable costs and timing. These scenarios are not probabilities or product performance claims.
Service architecture
Put Japanese data behind a repeatable customer workflow.
Read the diagram, assumptions and sources
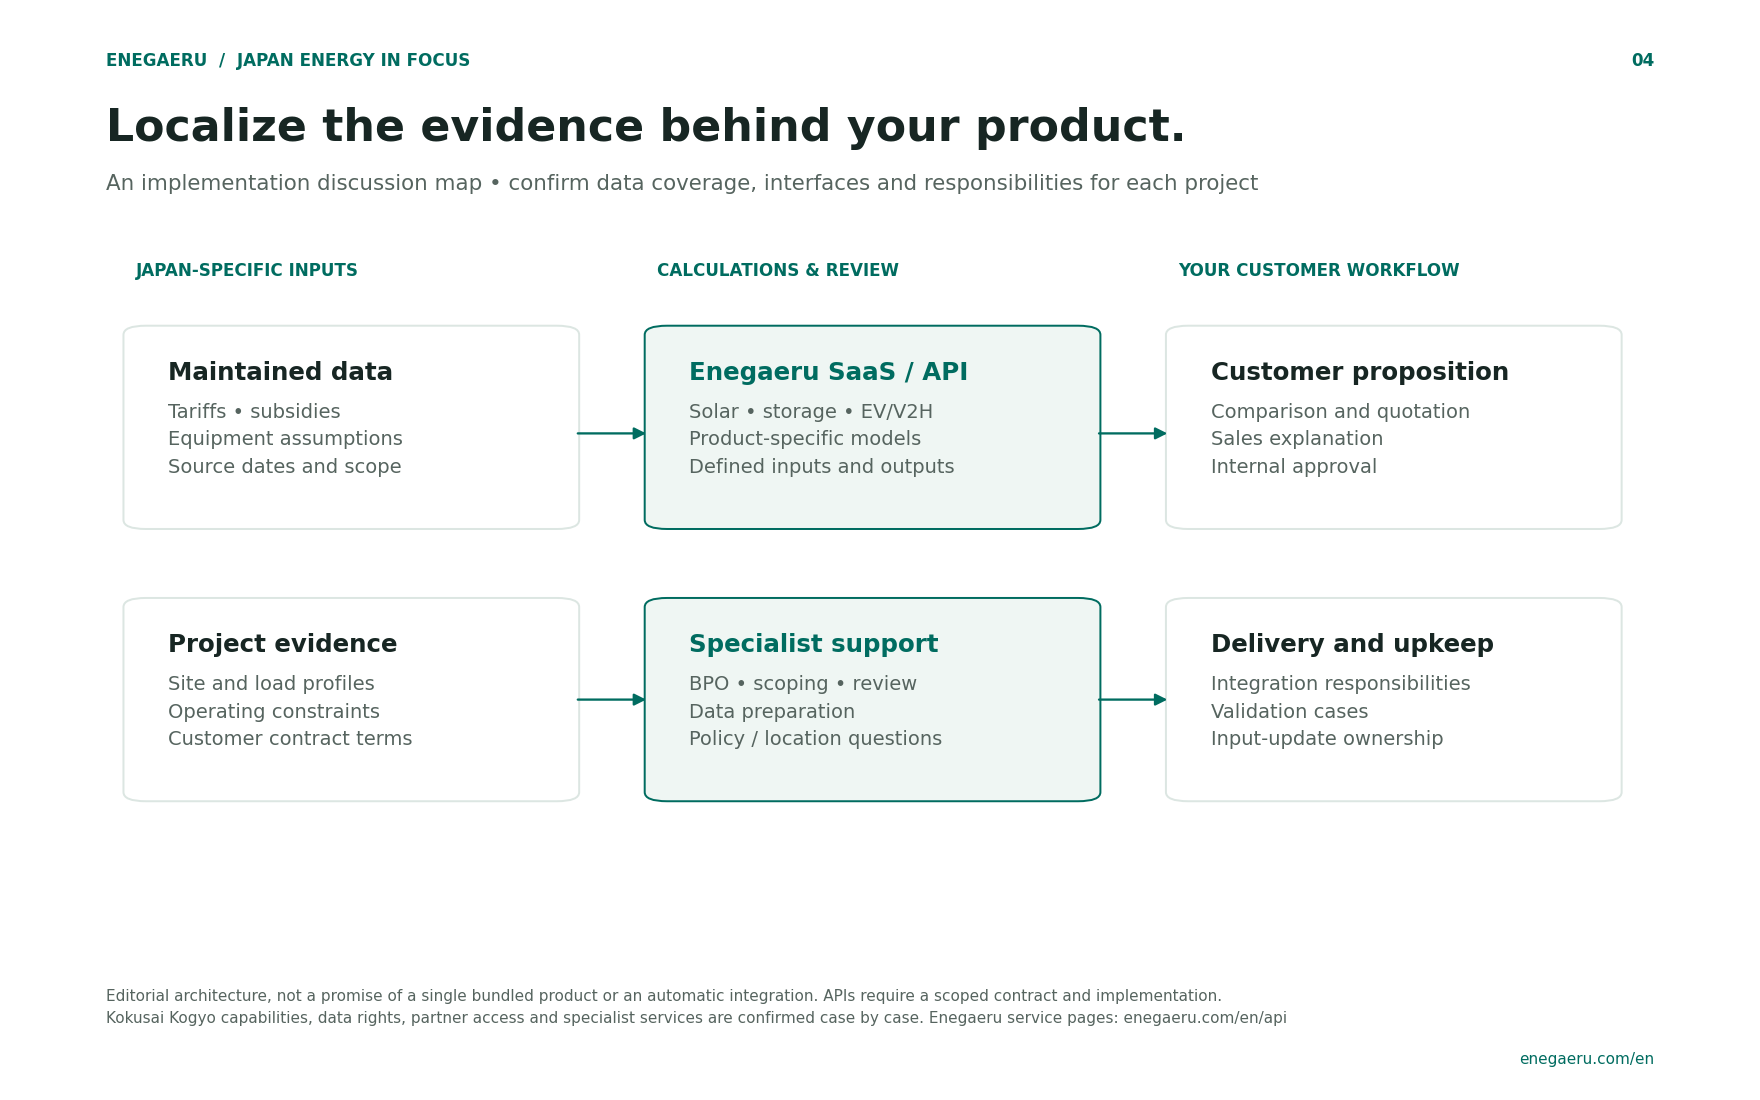
The upper path connects maintained tariff, subsidy and equipment inputs to product-specific Enegaeru SaaS or API calculations, then to comparisons, quotations and internal approvals. The lower path connects site evidence and contract conditions to scoped BPO or specialist support, then to integration, validation and upkeep responsibilities.
This is an implementation discussion map. It does not claim a single bundled service, automatic integration, universal database coverage or guaranteed access to partner networks. Confirm the selected product, licensed data use, interface, language support and specialist scope.
Explore APIs and data, BPO, Kokusai Kogyo and alliance discussions.
Editorial review framework
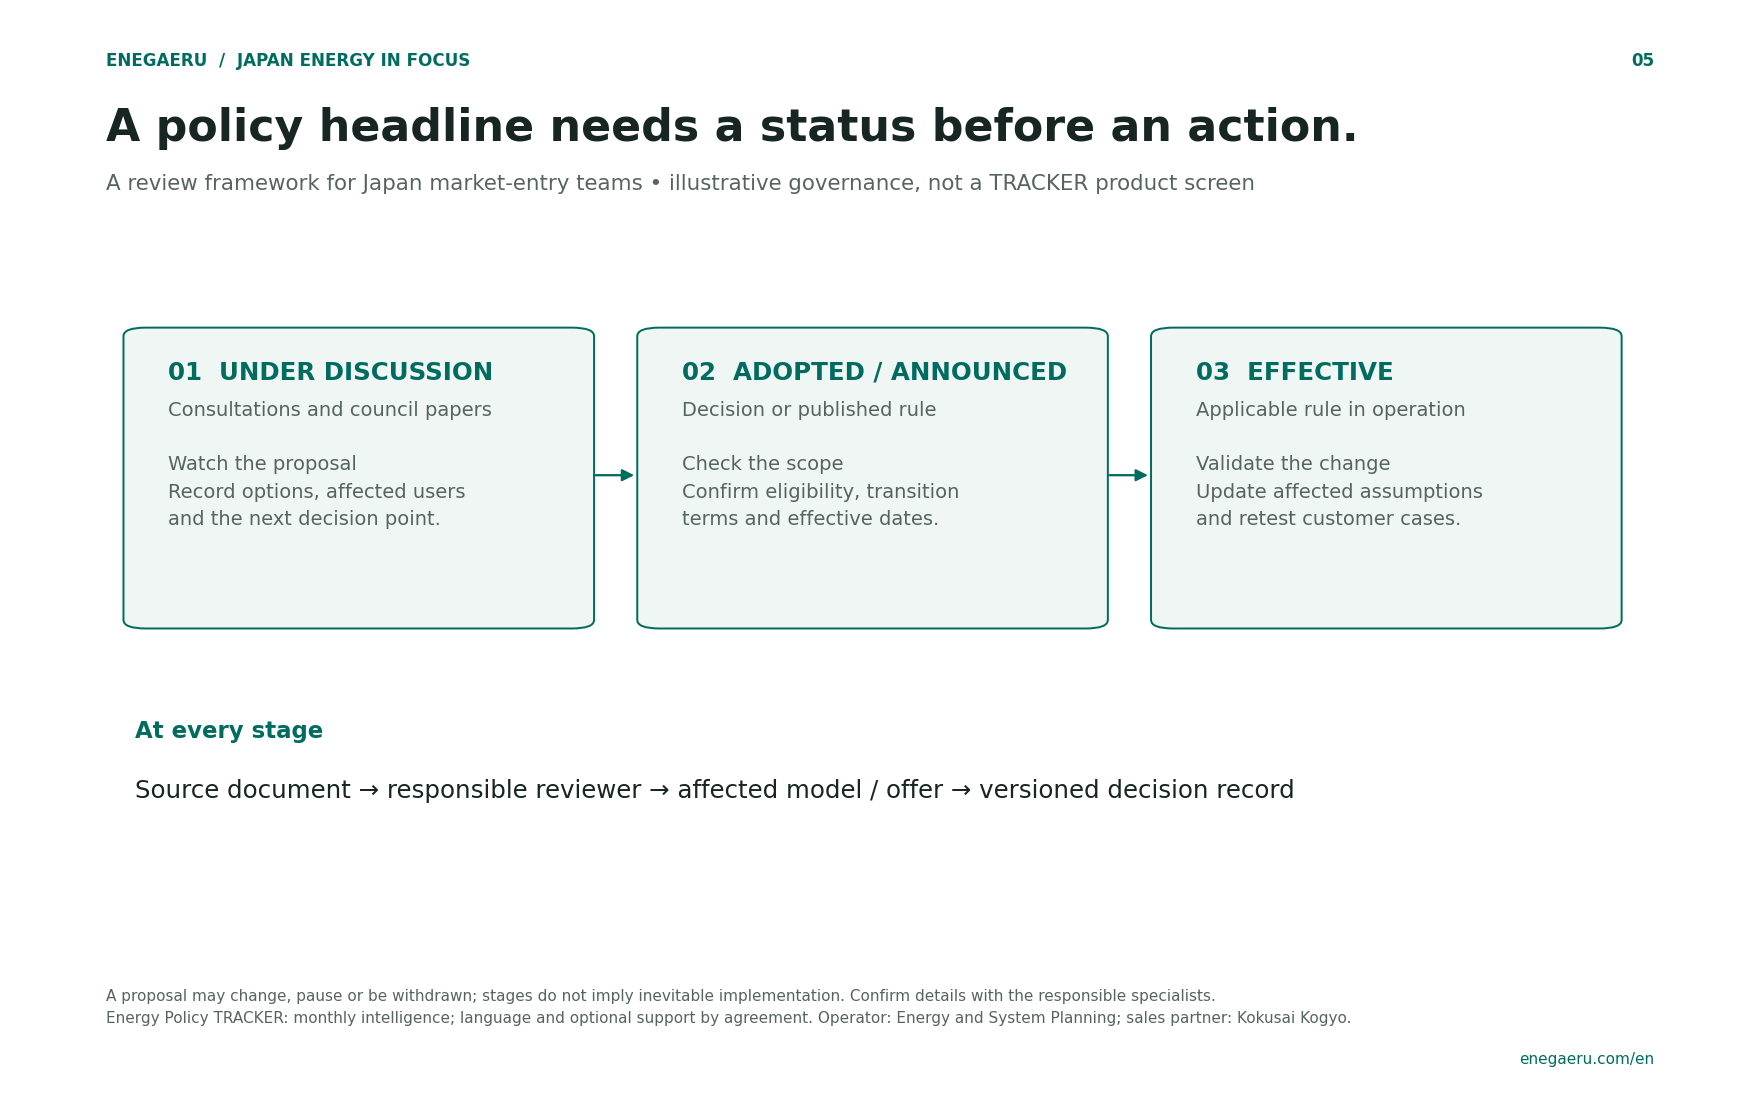
Connect policy status to the action your team should take.
Read the diagram, assumptions and sources
- Under discussion: record the source, options, affected users and next decision point.
- Adopted or announced: confirm the actual decision, scope, eligibility, transitional provisions and effective dates.
- Effective: validate the applicable rule, update affected assumptions and retest the relevant customer cases.
At every stage, retain the source, responsible reviewer and decision record. Proposals can be changed, paused or withdrawn; the arrows do not imply inevitable implementation.
This is an editorial governance framework, not a product screenshot or a claim that TRACKER performs automated model updates. Energy Policy TRACKER is a route to monthly intelligence. Energy and System Planning operates the service; Kokusai Kogyo is a sales partner. Report language and optional support are agreed separately.
Sales and market-entry framework
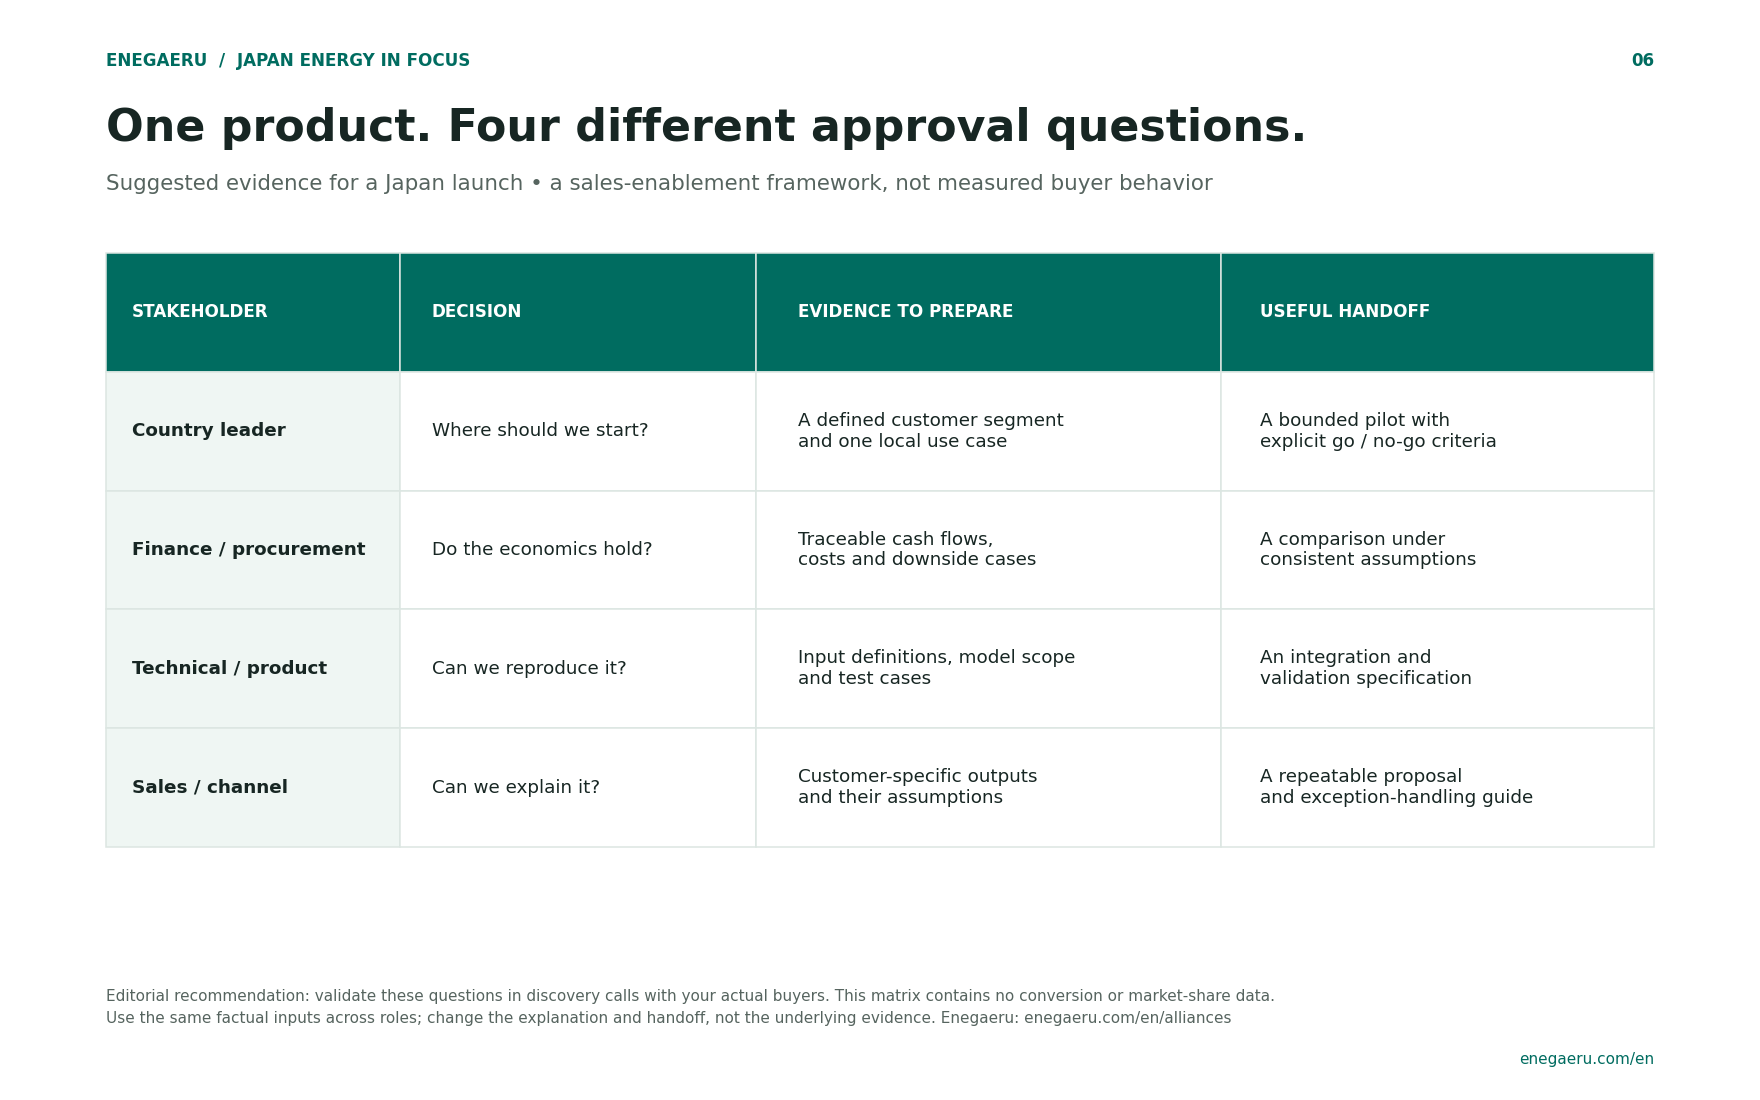
Equip each stakeholder to answer their own approval question.
Read the diagram, assumptions and sources
- Country leader: Which segment and local use case should we start with? Prepare a bounded pilot and explicit go/no-go criteria.
- Finance and procurement: Do the economics hold? Prepare traceable cash flows, costs and downside cases under consistent assumptions.
- Technical and product: Can the result be reproduced? Prepare input definitions, model scope, test cases and an integration specification.
- Sales and channel: Can the result be explained to a customer? Prepare customer-specific outputs, assumptions and an exception-handling guide.
This is a suggested discovery and sales-enablement framework. It is not a survey of Japanese buying behavior and contains no measured conversion uplift. Validate it with the people involved in your actual target accounts.
Turn a useful diagram into a decision about your project.
Bring a target customer, tariff, equipment specification or proposed workflow. We can discuss what should be tested with Enegaeru software, APIs, BPO or a scoped development project.